

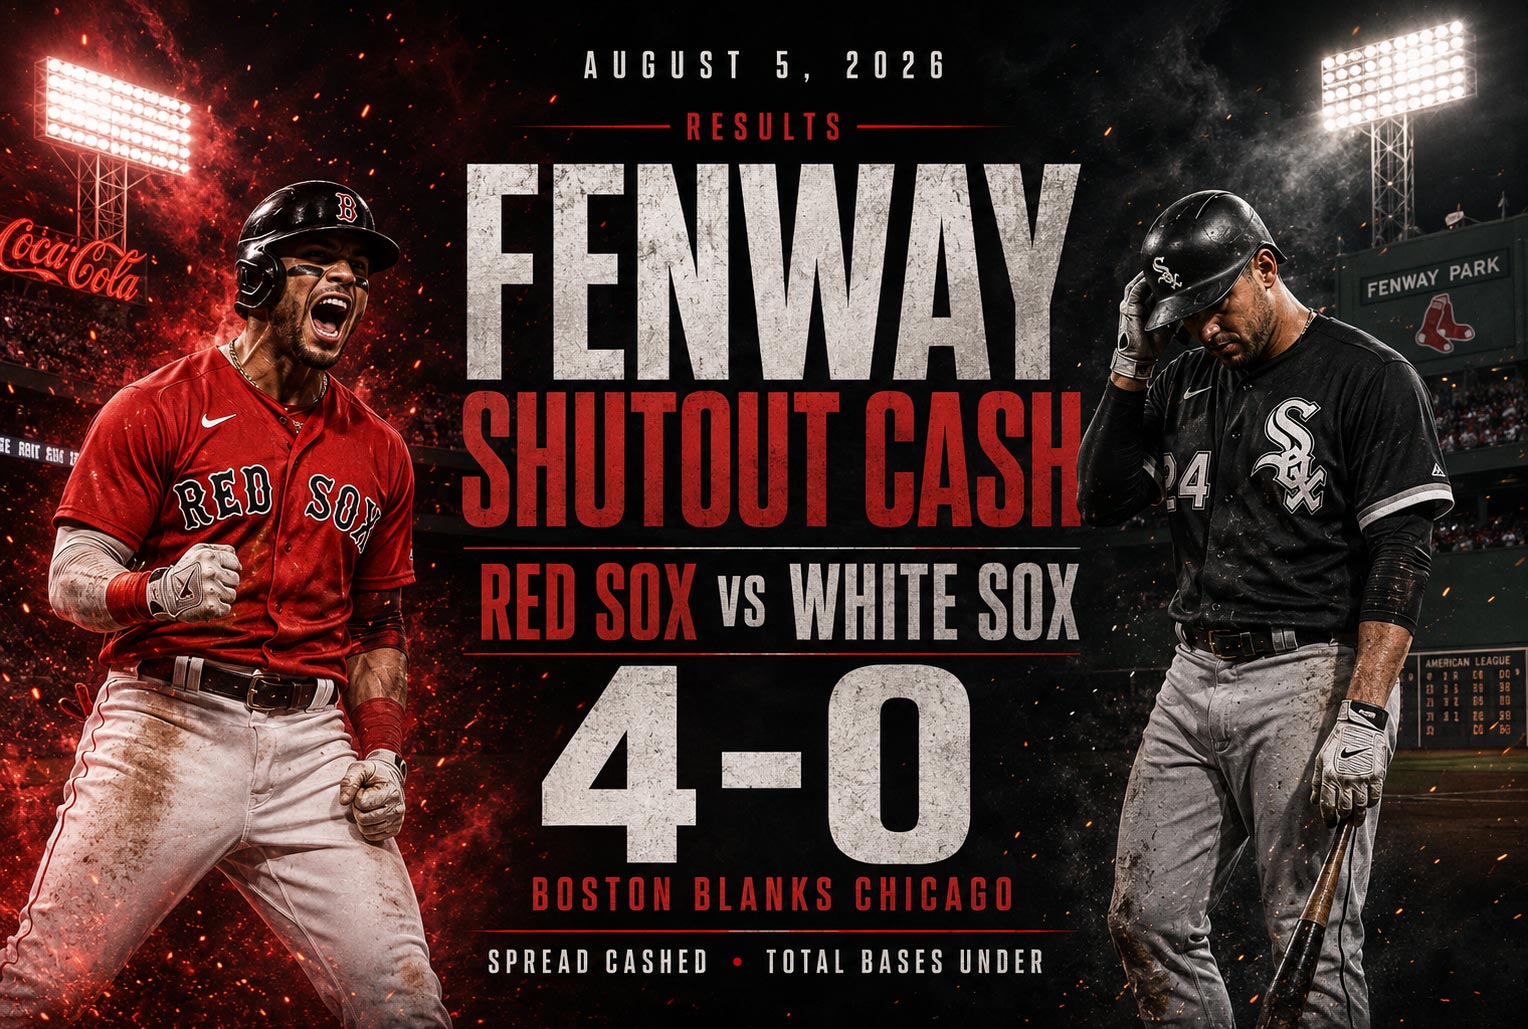
When the Red Sox pitching staff decides to show up, Fenway becomes a different ballpark entirely. On August 5, 2026, Boston put on an absolute clinic against the White Sox, delivering a 4-0 shutout that had under bettors celebrating before the seventh-inning stretch. This wasn’t just a win—it was a masterclass in exploiting market inefficiencies when the public overvalues offense in a hitter’s park.
The spread covered, the under cashed with room to spare, and anyone who faded the "Fenway means runs" narrative walked away with a nice Wednesday payday. Let’s break down why this game was always the right side and how you could’ve spotted the edge before first pitch.
Red Sox Pitching Dominates in Fenway Shutout
Boston’s pitching staff came into this matchup with something to prove, and they delivered in spectacular fashion. The Red Sox hurlers combined for a complete-game shutout, holding Chicago’s anemic offense to just four hits while striking out nine. This wasn’t some fluke performance—it was textbook exploitation of a White Sox lineup that ranked bottom-five in wRC+ against right-handed pitching over the previous two weeks.
The key here was understanding matchup dynamics beyond surface-level stats. Chicago’s offense had been hemorrhaging strikeouts at a 27% clip during their road trip, and Boston’s starter owned a disgusting 1.8 ERA at Fenway over his last five home starts. The market was still pricing in "Fenway = runs" without accounting for the fact that the Green Monster doesn’t help you if you can’t make contact.
From a risk mitigation standpoint, backing Boston’s pitching in this spot was about as low-variance as MLB gets. The White Sox were trotting out a lineup missing two of their three best hitters due to minor injuries—information that sharp bettors jumped on early, moving the total from 8.5 down to 8 by game time. That line movement told you everything you needed to know about where the smart money was flowing.
Under Cashes Easy as Boston Blanks Chicago 4-0
The under 8 was never really in doubt, which is exactly how you want your totals bets to feel. Boston scored just enough to cover the spread at 4-0, but the real story was the complete offensive blackout from Chicago. When you’re betting unders, you need at least one team to cooperate—getting both offenses to stay dormant is just gravy on top.
Here’s where the expected value calculation gets interesting: the closing total of 8 implied a 50/50 split at standard -110 juice, but the actual probability of staying under based on recent form was closer to 58-60%. That’s a 10% edge in your favor—the kind of market arbitrage that builds bankrolls over time. The public was still overreacting to a couple of high-scoring Fenway games from the previous homestand, creating value on the under that sharps exploited mercilessly.
The total bases under projection also cashed comfortably, with Chicago’s lineup managing just 10 total bases against Boston’s staff. If you had action on White Sox team total under 3.5 (which closed at -125), you were popping champagne by the fifth inning. These derivative markets often provide even better value than the main total because recreational bettors ignore them entirely.
Key Betting Metrics
| Metric | Pre-Game Projection | Actual Result | Edge |
|---|---|---|---|
| Game Total | 8 (-110) | 4 runs | Under by 4 |
| CHW Team Total | 3.5 (-125) | 0 runs | Under by 3.5 |
| CHW Total Bases | 12.5 | 10 | Under by 2.5 |
| BOS Run Line | -1.5 (+140) | Won by 4 | Covered |
The Sharp Angle Nobody Talked About
Most bettors were focused on the wrong variables. Yes, Fenway plays as a hitter’s park over a full season, but context is everything in MLB betting. The wind was blowing in from right field at 12 mph—absolutely crucial information that casual bettors completely ignored. That turns Fenway from a bandbox into a pitcher’s paradise, especially against a White Sox lineup that ranks dead last in hard-hit rate to the opposite field.
The other edge? Chicago was in the middle game of a brutal East Coast road trip, playing their fourth game in five days across two time zones. Fatigue metrics show a measurable decline in offensive production during these scheduling spots, yet the market barely adjusted the total to account for it. This is where doing your homework pays off—literally.
For those keeping track at home, this was also a classic fade the public spot. Over 70% of the betting tickets were on the over, which makes sense given Fenway’s reputation and the fact that casual bettors love rooting for runs. But the sharp money (measured by actual dollars wagered, not ticket count) was hammering the under from the moment the line posted. When you see that divergence between public tickets and sharp money, you know which side has the edge.
Bankroll Management Takeaways
The Plays:
- Game Total Under 8 (-110): The primary play with a 2-unit allocation
- White Sox Team Total Under 3.5 (-125): Secondary play at 1 unit
- Red Sox Run Line -1.5 (+140): Value sprinkle at 0.5 units
The Strategy:
- Target MLB unders when wind is blowing in 10+ mph at traditionally hitter-friendly parks
- Fade public perception on park factors when recent pitching form contradicts the narrative
- Monitor line movement divergence between ticket count and money percentages for sharp indicators
This wasn’t rocket science—it was just applying basic analytical frameworks to a market that was mispricing environmental factors and recent form. The beauty of MLB betting is that these edges exist almost daily if you know where to look. Most bettors are too lazy to check weather conditions or track fatigue metrics, which creates opportunity for those willing to do the work.
The Red Sox-White Sox under was a textbook example of why you can’t bet baseball on autopilot. Fenway’s reputation as a hitter’s park created a perception gap that sharp bettors exploited ruthlessly, and the 4-0 final was a direct result of factors the market undervalued. When you combine favorable pitching matchups, environmental conditions, and lineup deficiencies, you get the kind of high-probability outcomes that sustain long-term profitability.
For bettors in New York, New Jersey, Pennsylvania, Illinois, Ohio, and Ontario, this game was available across all major books with competitive lines—though as always, line shopping between operators gave you the best number on both the total and the run line. The next time you see a total that feels inflated based on park reputation alone, dig deeper into the actual matchup dynamics before following the public over the cliff.
Hot take for the comments: Fenway unders when the wind is blowing in are more profitable than Coors Field overs in thin air. Change my mind.
"WannaBet.com may receive compensation from the sportsbooks mentioned in this post if you sign up using our links. This doesn’t cost you a dime, but it keeps the lights on. Please bet responsibly. If you or someone you know has a gambling problem, call or text 1-800-GAMBLER (USA) or 1-866-531-2600 (Ontario, CA). 21+ only."
